econ p.i. logo

Quick, unbiased view of the economy...

"Insensibly one begins to twist facts to suit theories, instead of theories to suit facts."        — Sherlock Holmes, A Scandal in Bohemia
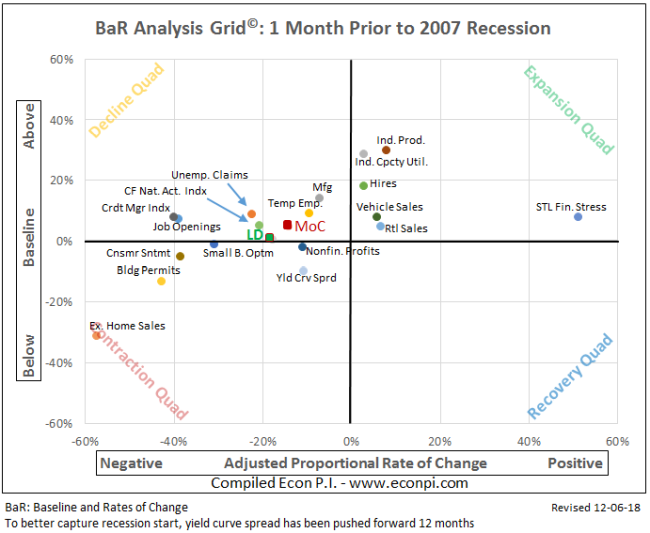
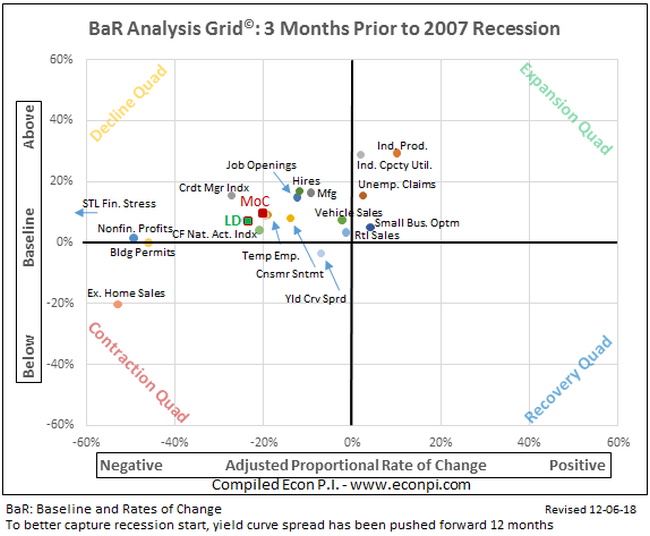
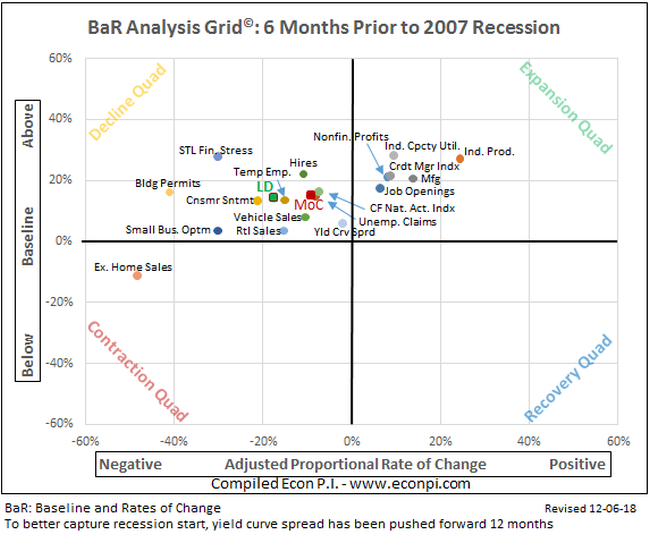
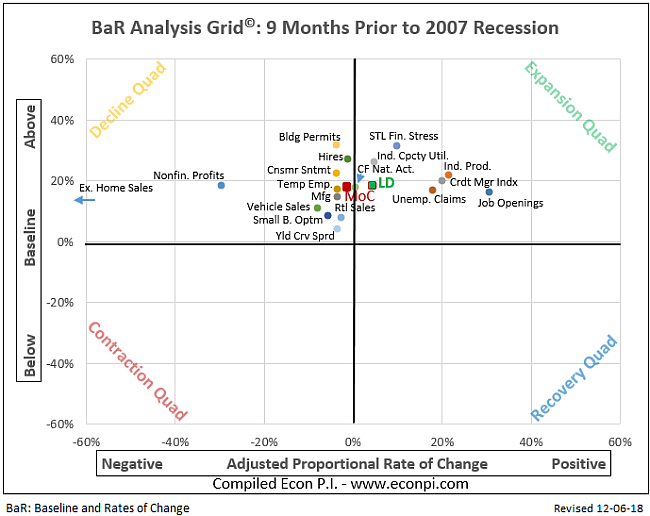
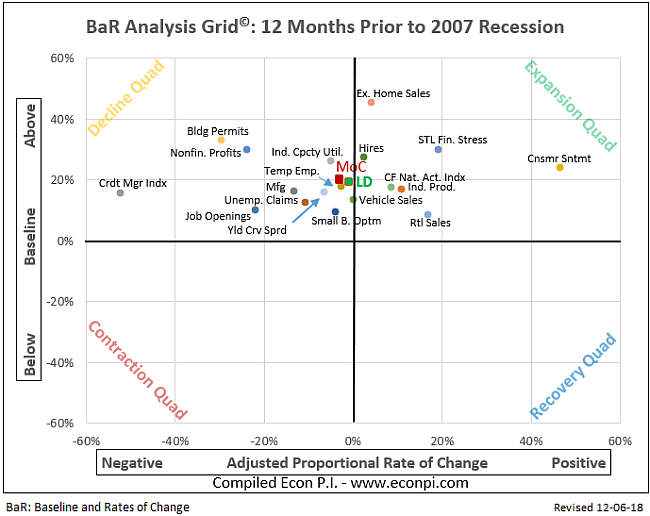
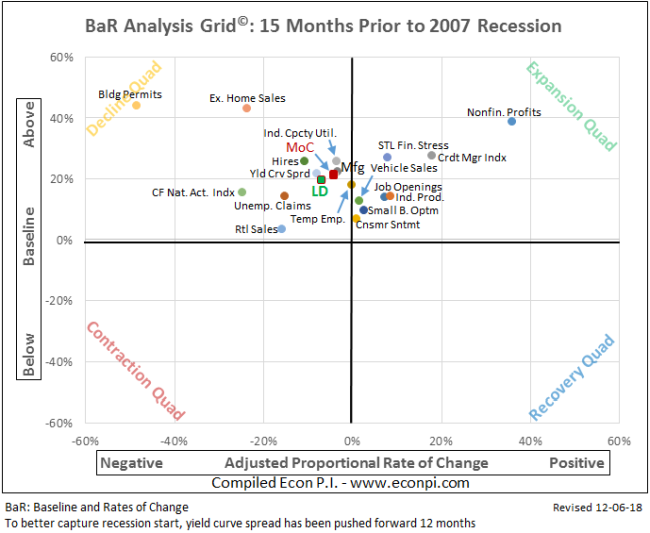
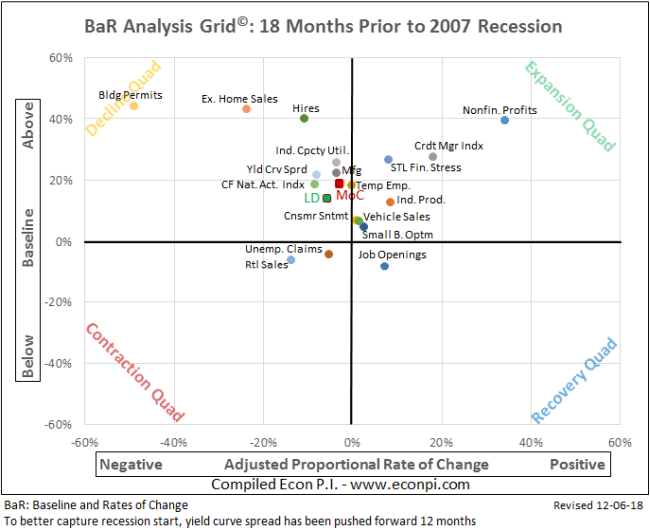
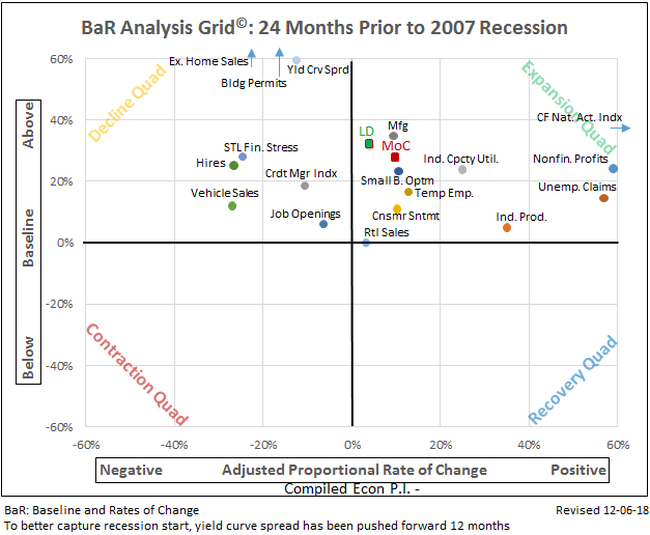
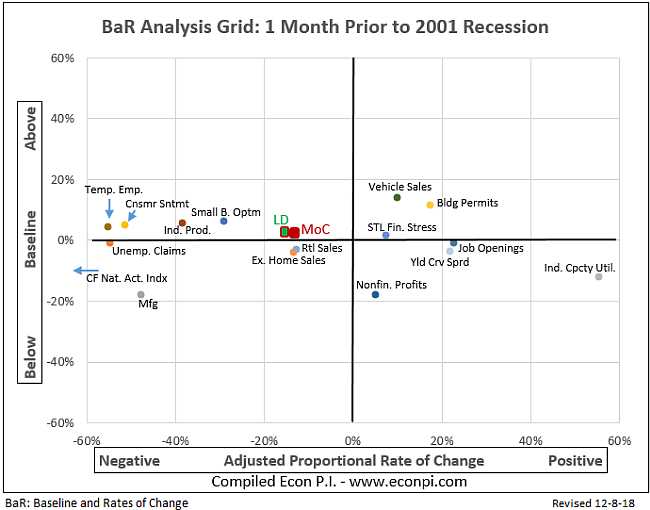
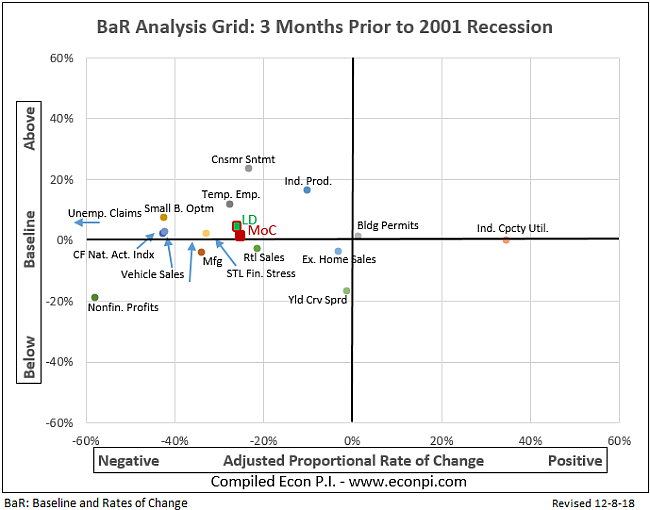
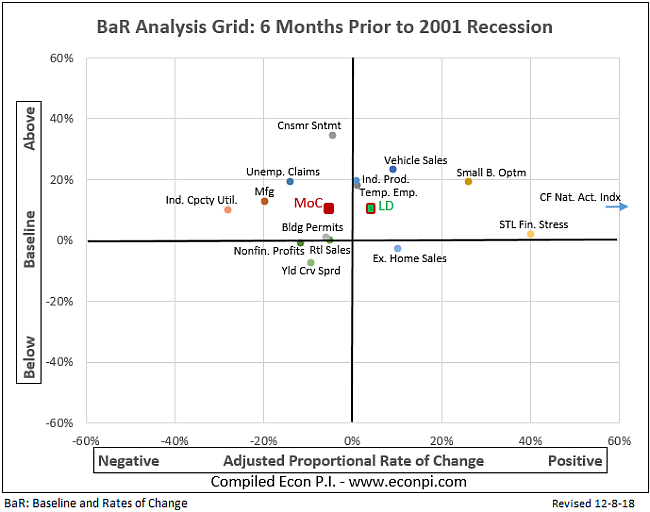
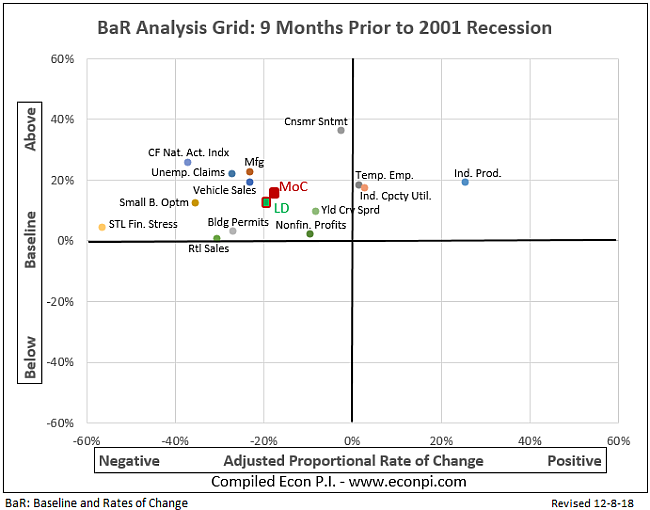
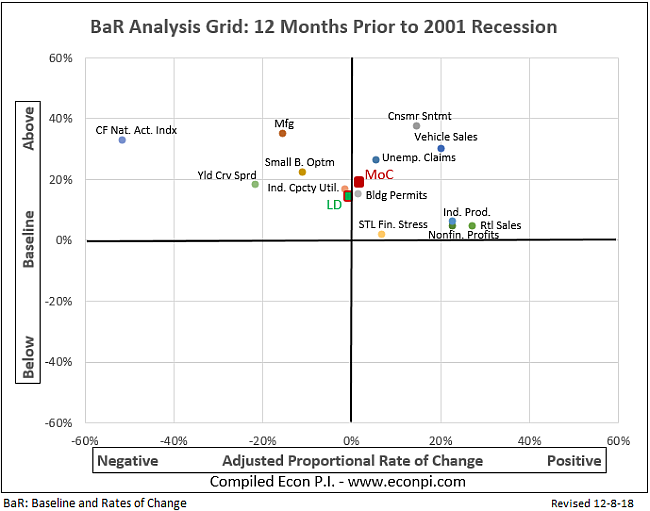
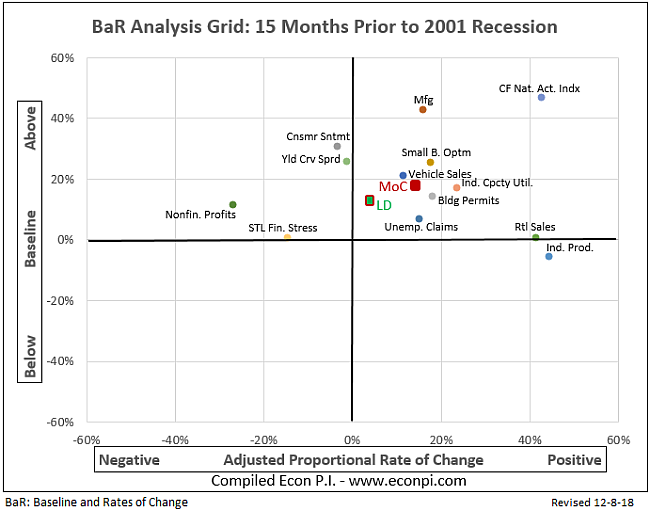
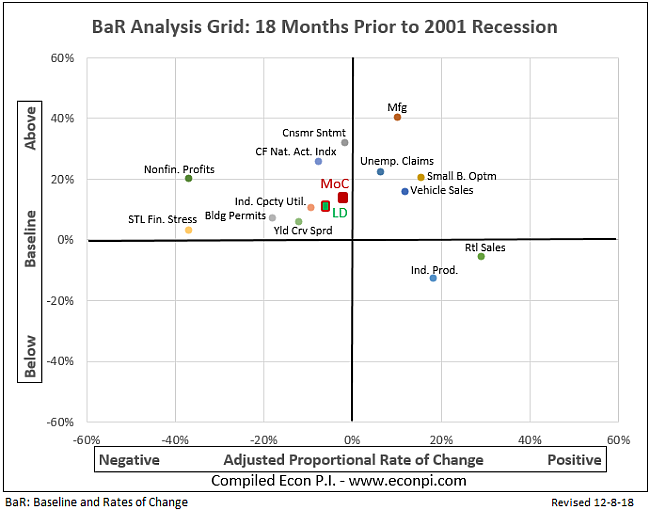
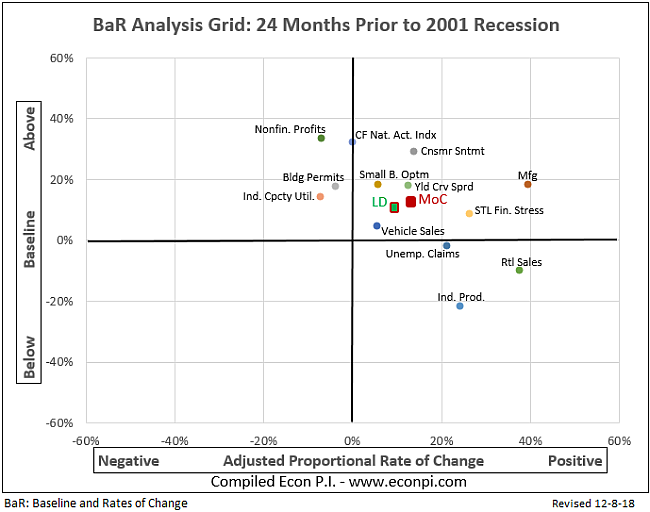
Mapping the Road to Recession

Click on the arrows to see how the economy progressed towards the 2007 (top) and 2001 (bottom) recessions. The mean of coordinates (MoC) is the average of all plotted points. It signals the overall health of the economy. The leading indicator coordinates (LD) is the average of the eight leading indicators plotted on the BaR (see FAQ). Recessions occur when the MoC nears the baseline. 

2007 Recession

  • 2007-1-Month.png
  • 2007-3-Month.png
  • 2007-6-Month.png
  • 2007-9-Month-a.png
  • 2007-12-Month-a.png
  • 2007-15-Month.png
  • 2007-18-Month.png
  • 2007-24-Month.png


2001 Recession

  • 2001-1-Month-LD.png
  • 2001-3-Month-LD.png
  • 2001-6-Month-LD.png
  • 2001-9-Month-LD.png
  • 2001-12-Month-LD.png
  • 2001-15-Month-LD.png
  • 2001-18-Month-LD.png
  • 2001-24-Month-LD.png


Contact                    About                    Terms of Use                    Privacy Policy           

Copyright © 2015 - 2022 All Rights Reserved

Information provided on econpi.com is for informational purposes only. By using this site you agree that no advisory, fiduciary, or professional services relationship is created between you and econpi.com. No information provided on this site shall be construed as legal, accounting, investment, financial, tax, or other professional advice on any matter.