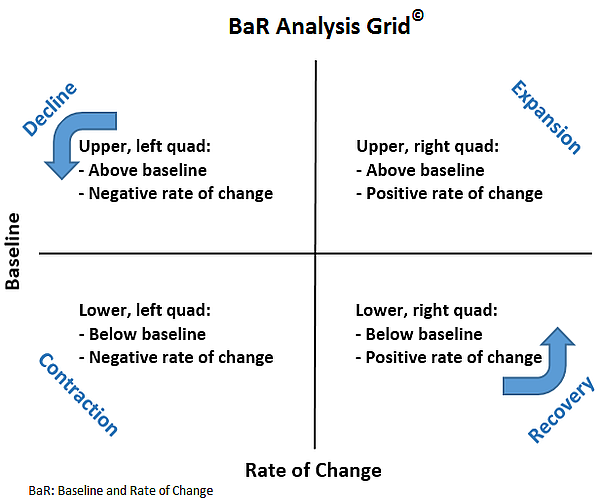
| Baseline and Rate of Change (BaR) Analysis Grid© | ||
By plotting 18 key economic indicators, the BaR captures economic activity, sentiment, and outlook at a given period of time. The BaR:
|
||
| The economy is expanding when the MoC shifts to the right and moves upward. The economy is slowing when the MoC shifts to the left and moves downward. |
||
 |
||
How to Read the BaR |
||
Positive economic growth The BaR indicates expanding economic growth when the majority of the plotted economic indicators (blue points) and the MoC (mean of coordinates - red point) are in the expansion quadrant and well above the baseline. 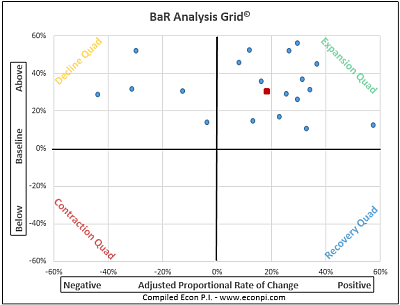 |
||
Positive, but slowing economic growth Economic growth is cyclical. During an expansion cycle, indicators hits new highs, then stall or decline slightly, then move upward again. This can result in a number of economic indicators moving into the decline quadrant and the MoC shifting leftward. With such a movement, as long as the MoC and the economic indicators remain above the baseline, the economy is still growing, but at a decreasing rate of growth. 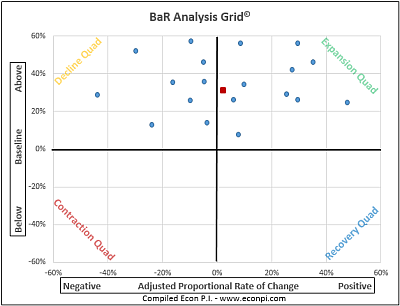 |
||
| For example, a drop in building permits from 1.36 million to 1.30 million would be a decrease in the rate of change. Although growth is still positive (1.30 million permits were issued), the rate of change is negative. The indicator would be plotted in the decline quadrant. All indicators periodically move into the decline quadrant, even as the economy is expanding. A red flag is raised when an increasing number of indicators stay predominately in the decline quadrant and move closer to the baseline. | ||
Slowing economic growth, pre-peak or post-peak Even when the economy is growing, due to the cyclical nature of the economy, the MoC and a majority, or near majority, of economic indicators may occasionally move into the decline quadrant. During periods of economic growth, this will be temporary. The MoC and most indicators will move back into the expansion quadrant. However, if the economy has peaked, a grid like the one shown below is a pre-recessionary pattern. As the economy slows, the MoC will mostly stay in the decline quadrant and gradually move towards the baseline. 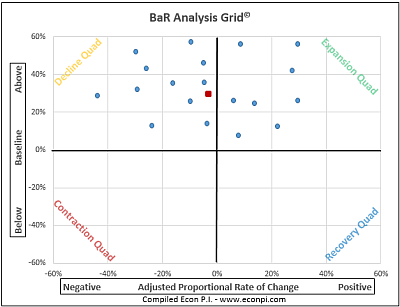 |
||
Stalling economic growth When the MoC mostly stays in the decline quadrant and several economic indicators are nearing or have gone below the baseline, this indicates that the economy is stalling. Although the economy can recover briefly, and the MoC may shift to the expansion quadrant, this will be temporary. The economy is still growing, but at a declining rate. 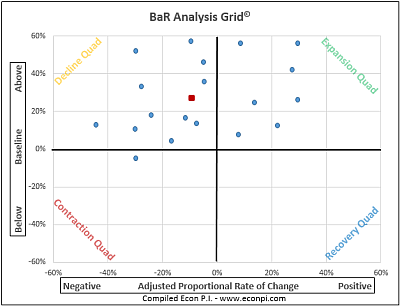 |
||
Nearing economic recession After the economy has peaked and the MoC has mostly remained in the decline quadrant, as more and more economic indicators near or go below the baseline, this indicates that recessionary conditions are building. Here too, the economy is growing, but it has slowed significantly. 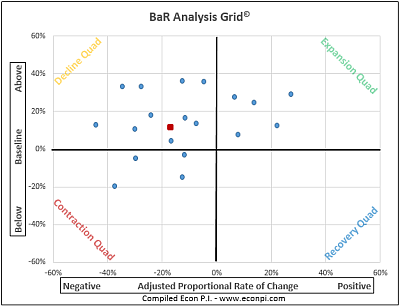 |
||
Economic recession When the MoC nears or goes below the baseline, this generally indicates that the economy has begun a recession. If a recession has not begun, the economy is highly vulnerable to one. 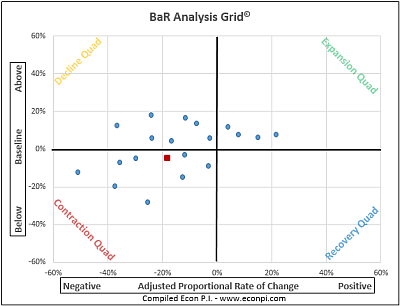 |
||
Economic recovery When a recession ends, the MoC and most indicators will move into the recovery quadrant. However, again due to the cyclical nature of the economy, during recovery the MoC can shift into the contraction quadrant occasionally. This is usually temporary, but it does indicate there is some economic vulnerability during a recovery. 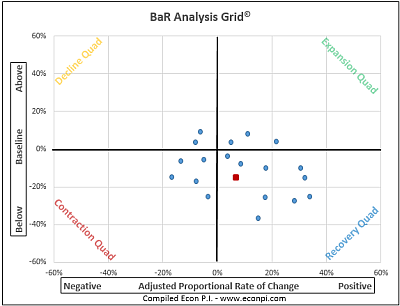 |
||
|
Baselines |
||
 |
![]()
Quick, unbiased view of the economy...
"Insensibly one begins to twist facts to suit theories, instead of theories to suit facts." — Sherlock Holmes, A Scandal in Bohemia