| Economic Indicator Charts with Baselines |
| The BaR Analysis Grid© uses economic indicators that correlate strongly with the ups and downs of a business cycle and show a consistent pattern of decline prior to recessions. Indicators can be divided into two groups: static and dynamic. Static indicators, like the Chicago Fed National Activity Index and the St. Louis Fed Financial Stress Index, have a consistent recession signal range, resulting in baselines that are are the same from business cycle to business cycle. Other indicators, such as retail sales and building permits, are dynamic, meaning that the indicator values and baseline estimate change with each business cycle. The recession baselines for dynamic economic indicators are based on the values seen when previous recessions have started. During a business cycle, after an indicator hits a peak value it will decline until a recession starts. The baseline is largely determined by how much an indicator normally decreases from peak to recession start in previous business cycles. The charts shown below are snapshots taken in February 2022 |
| Building Permits Dynamic baseline; leading indicator 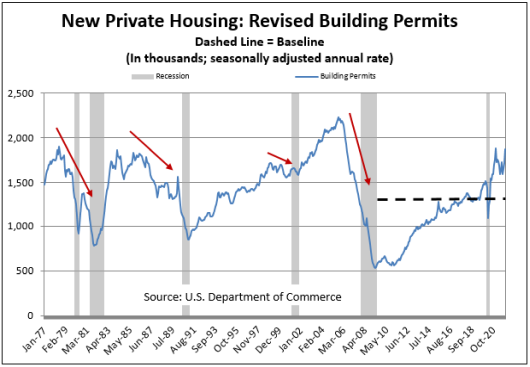 |
| Chicago Fed National Activity Index Static baseline 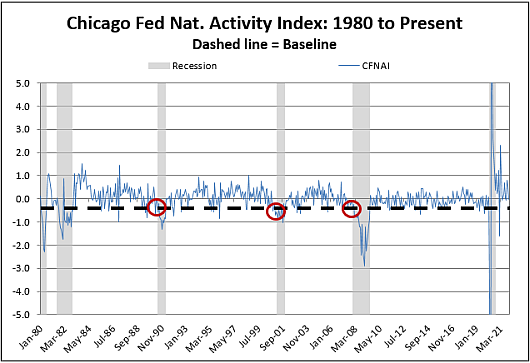 |
Consumer Sentiment Dynamic baseline; leading indicator 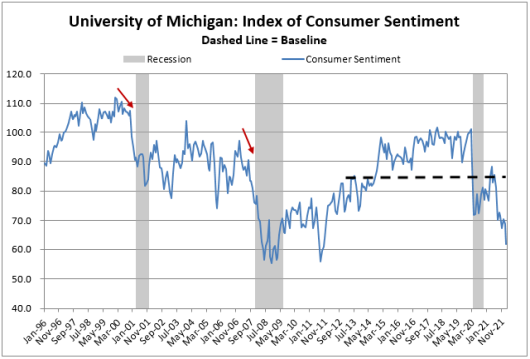 |
Real Nonfinancial Corporate Profits Dynamic baseline 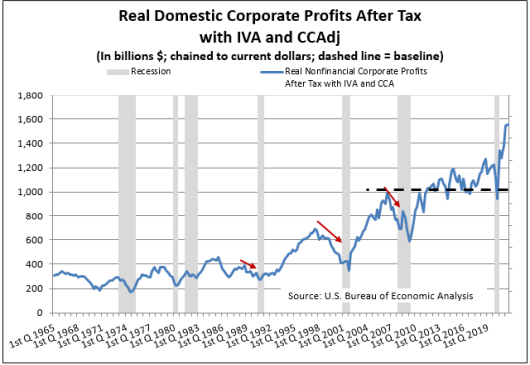 |
| Credit Managers' Index (National Association of Credit Managers) Static baseline 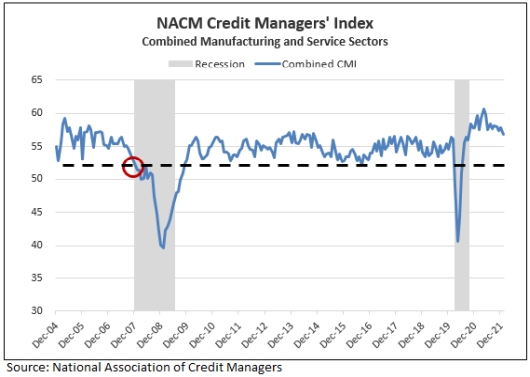 |
Existing Home Sales (National Association of Realtors) Dynamic baseline 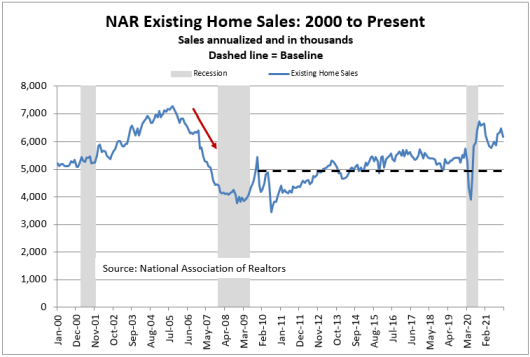 |
Industrial Production and Capacity Utilization Dynamic baseline 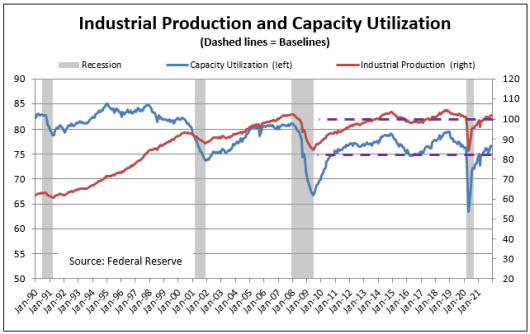 |
Job Openings and Hires Dynamic baseline 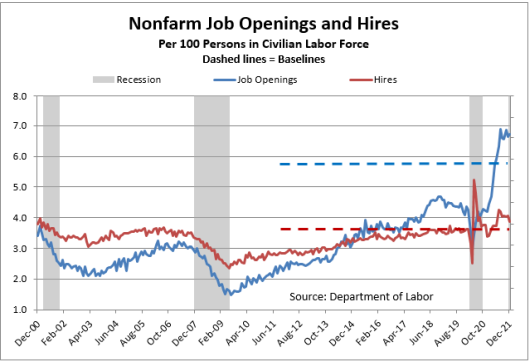 |
OECD Business Confidence Index Dynamic baseline 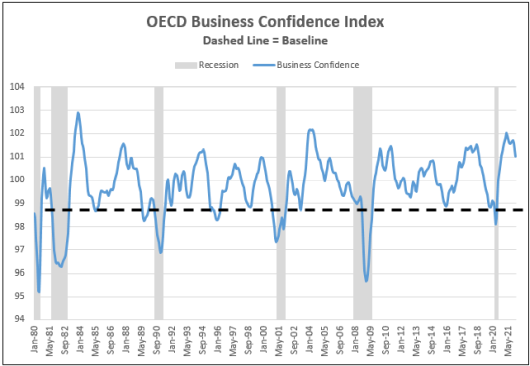 |
Real Retail Sales Per Capita Dynamic baseline 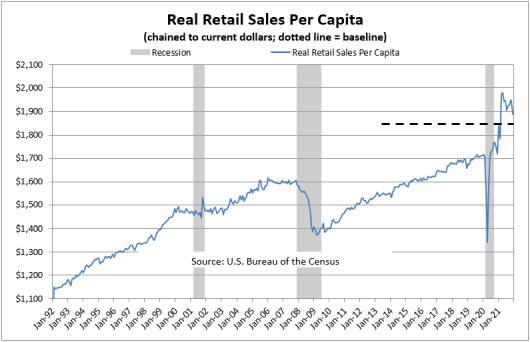 |
| Small Business Optimism (National Federation of Independent Business) Dynamic baseline; leading indicator 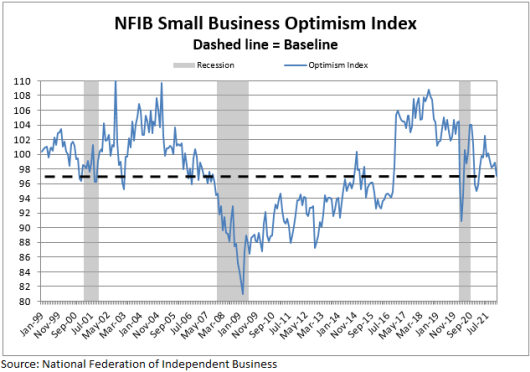 |
St. Louis Fed Financial Stress Index, Monthly Average Static baseline; leading indicator 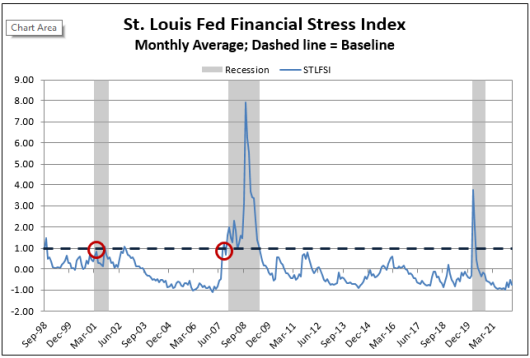 |
Temporary Employment Dynamic baseline; leading indicator 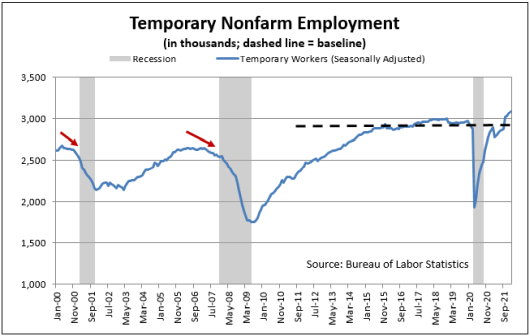 |
Weekly Unemployment Claims, Monthly Average Dynamic baseline; leading indicator 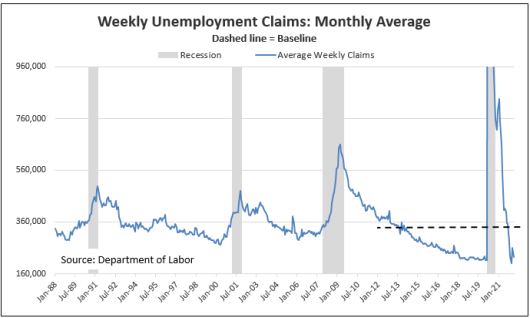 |
Vehicle Sales Dynamic baseline, leading indicator 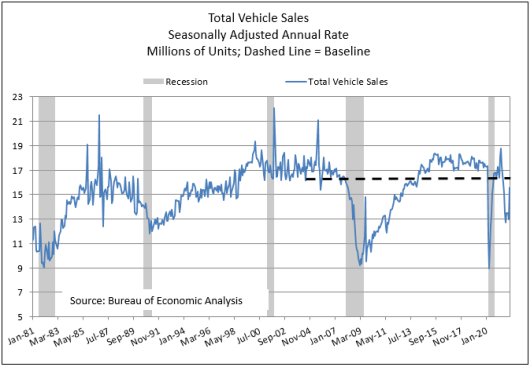 |
Yield Curve Spread, Monthly Average (10-year Treasury notes minus 2-year Treasury notes) Dynamic baseline, leading Indicator Note: The yield cure spread is pushed forward 12 months when plotted on the BaR Analysis Grid. Research by the Cleveland Fed has determined that the yield curve forecasts economic growth approximately one year in advance. Go here to see the Cleveland Fed's yield curve spread forecast. However, the 12 months is an average and the actual time forecast differs for each business cycle. 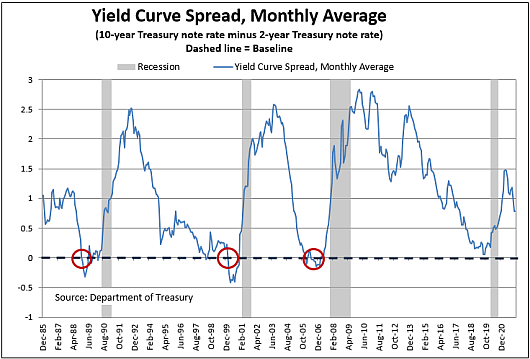 |
![]()
Quick, unbiased view of the economy...
"Insensibly one begins to twist facts to suit theories, instead of theories to suit facts." — Sherlock Holmes, A Scandal in Bohemia